BusinessInsight User Guide
Use this guide to walk through the product screens in order: admin sign-in, trial onboarding, role and user setup, dashboard administration, widget management, and mobile dashboard usage.
Each section shows the output screen first, then explains what the screen is for and the actions a user should take.
Client Admin - Sign In
Purpose
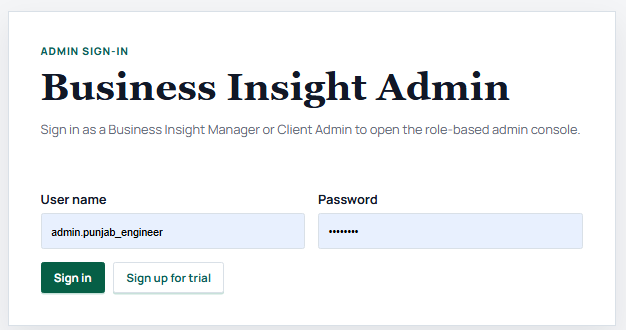
This screen verifies the user before any company, role, dashboard, or widget configuration is shown. It protects tenant setup and prevents non-admin users from opening the administration console.
How to use it
- Enter the assigned admin user name.
- Enter the password provided during setup or activation.
- Click Sign in to open the client admin workspace.
- Use Sign up for trial when a new company wants to start onboarding.
Client Admin - Company Roles and Users
Purpose
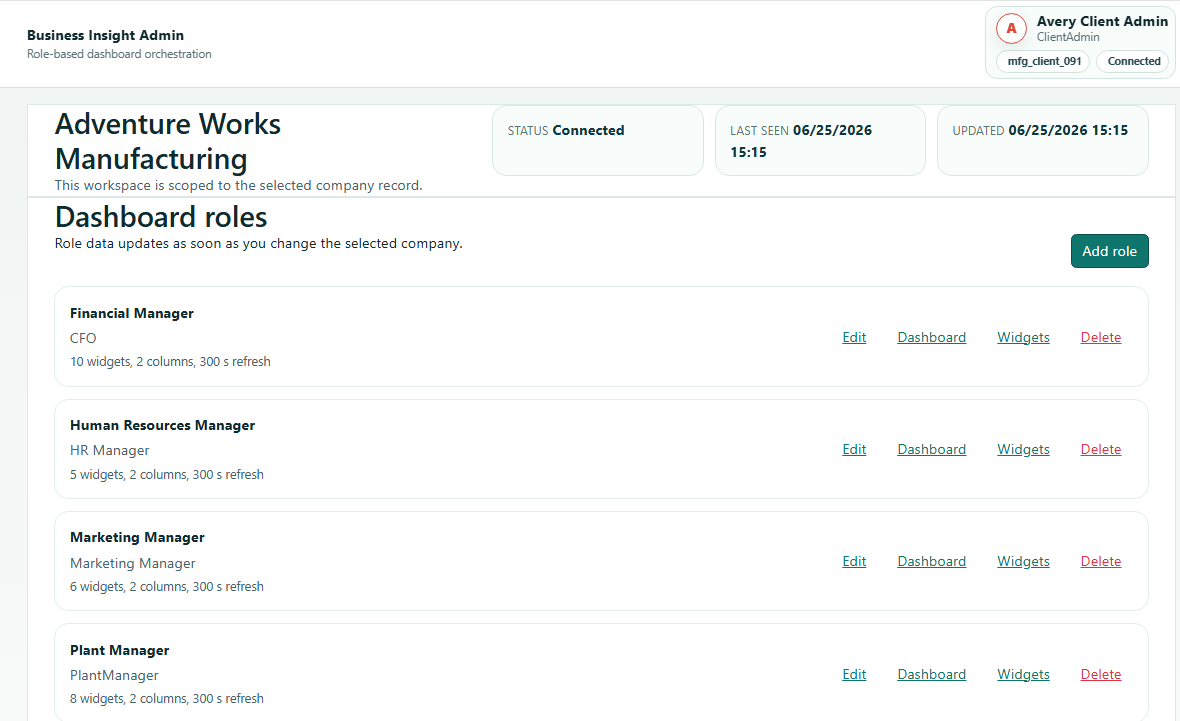
This screen organizes users by their responsibility. A company can create separate experiences for finance, HR, plant operations, marketing, ownership, or any custom role.
How to use it
- Review the roles already available for the company.
- Open a role to inspect its users and dashboard access.
- Add, edit, or deactivate users as responsibilities change.
- Use role separation to keep each manager focused on the correct metrics.
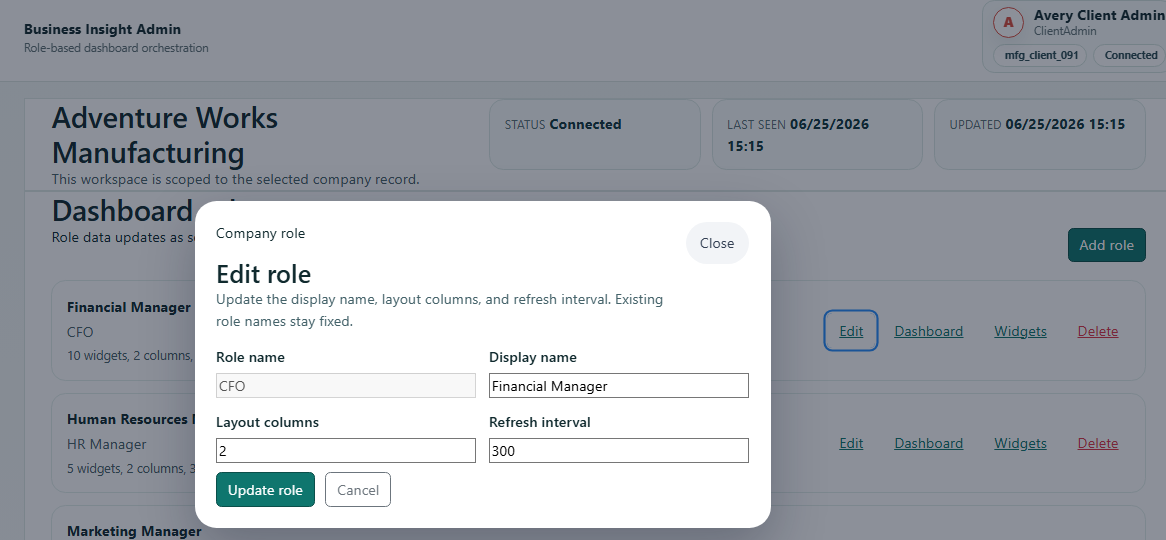
Client Admin - Edit Role
Purpose
Roles are the foundation of the BusinessInsight experience. A role explains who the dashboard is for and helps the system assign the right screens, widgets, and questions.
How to use it
- Update the role name so it matches the customer organization.
- Use a clear description that explains who should receive the role.
- Save the role before assigning users or dashboards to it.
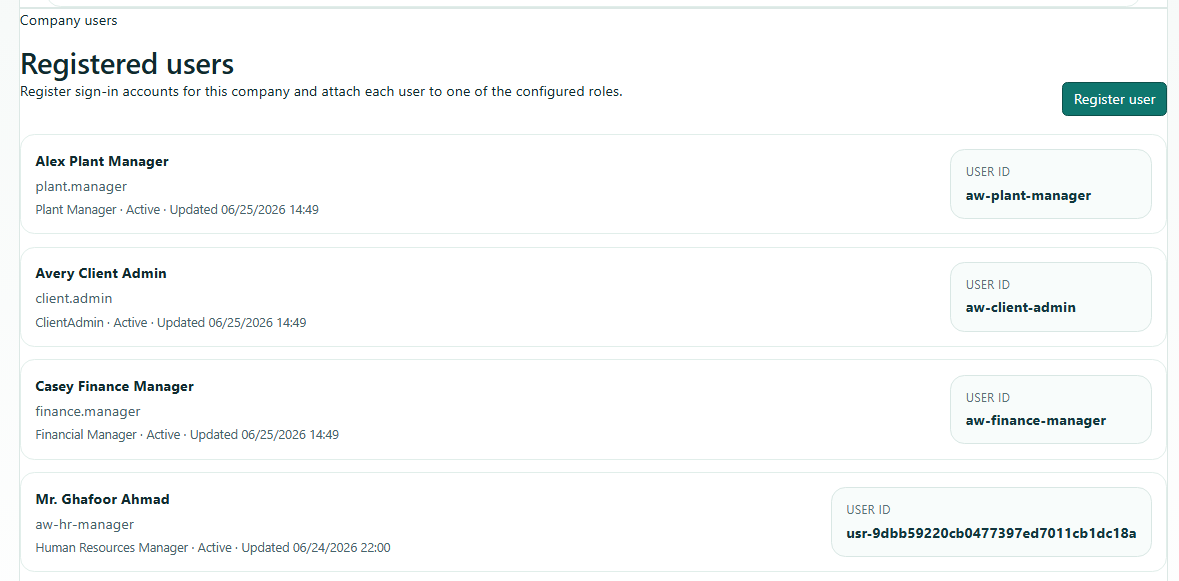
Client Admin - User Registration Under Roles
Purpose
The screen lets a client admin create or maintain business users inside a selected role. This is how a finance user receives finance dashboards while a marketing user receives marketing dashboards.
How to use it
- Select the role that the new user belongs to.
- Enter the user identity and login information.
- Activate the user only when the dashboard setup is ready.
- Keep inactive or departed users disabled to protect access.
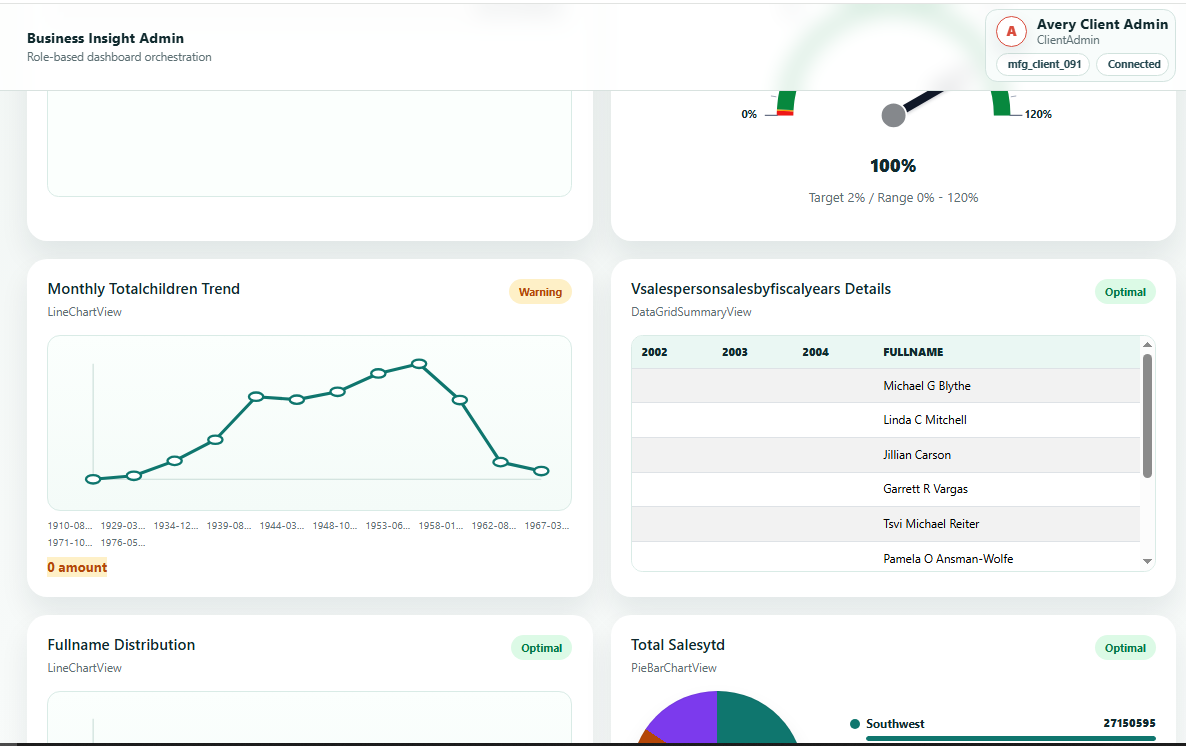
Client Admin - Dashboard Administration
Purpose
This screen confirms that BusinessInsight is role-based. The admin can review dashboards for different departments before users open them.
How to use it
- Select a role to preview the dashboard assigned to that role.
- Check whether the widgets match that manager's responsibility.
- Use the preview to validate layout and business meaning before rollout.
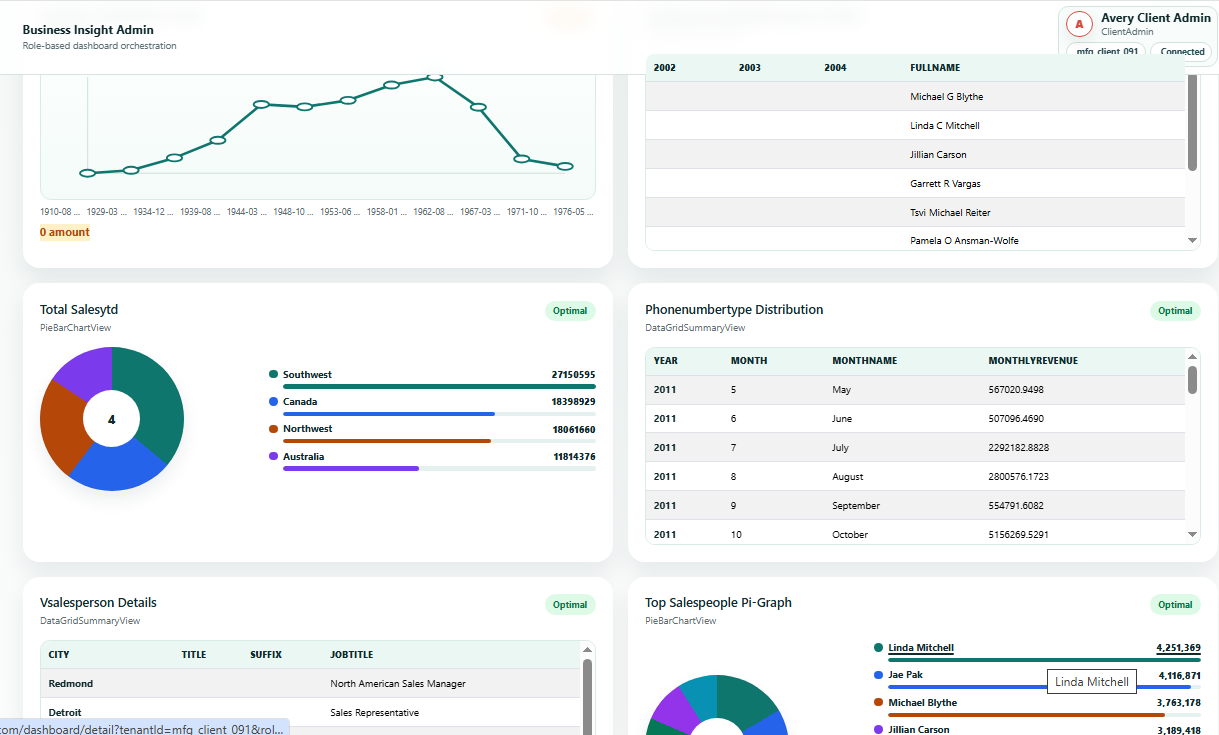
Role Dashboards
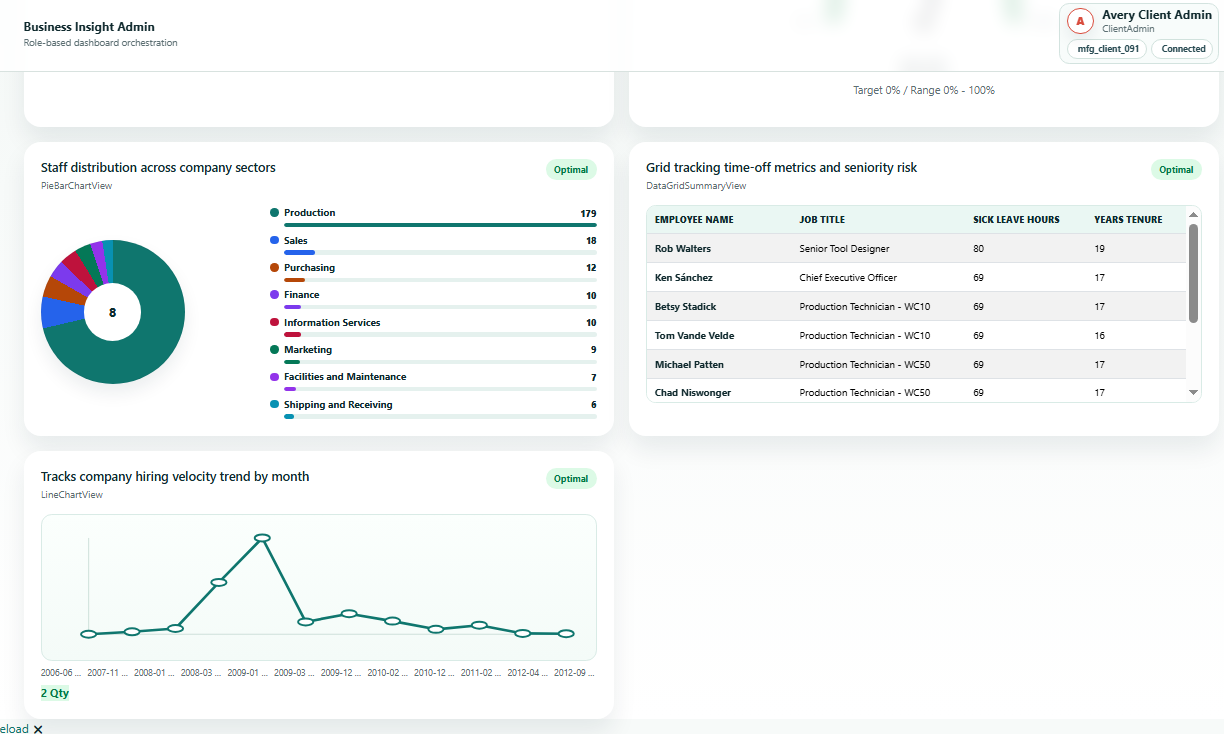
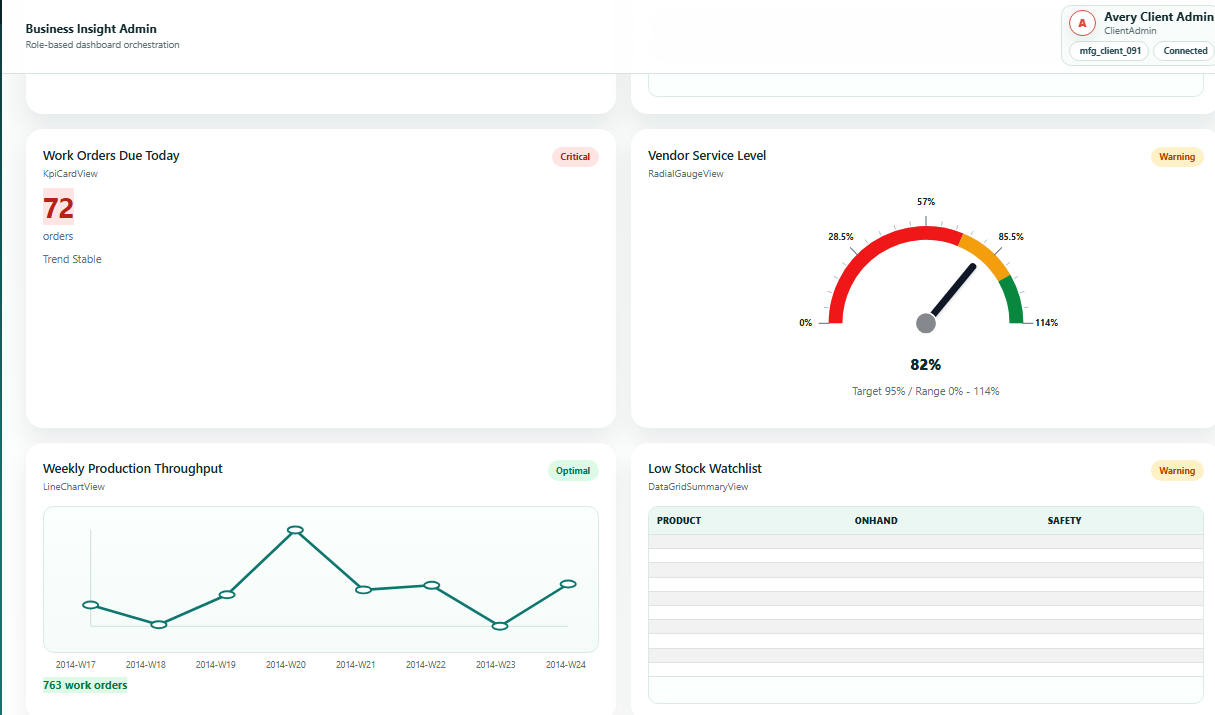
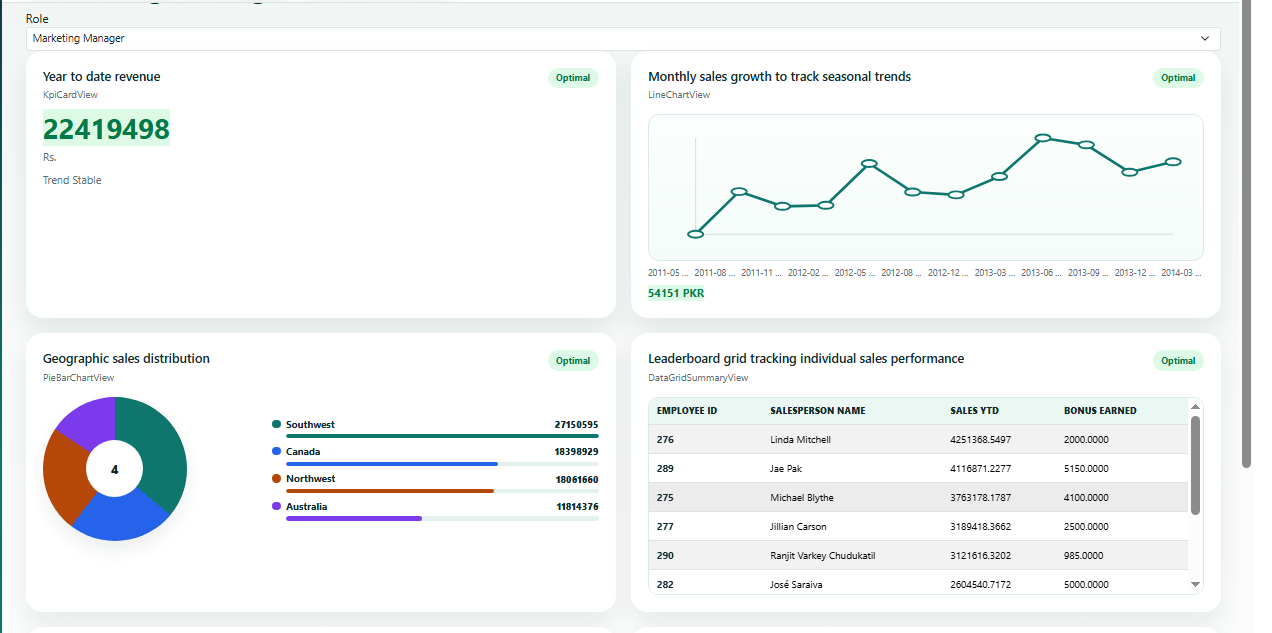
These screenshots show how dashboards change by business responsibility. Each role sees the KPIs, charts, and detail paths that matter to that department.
Client Admin - Widget Workshop
Purpose
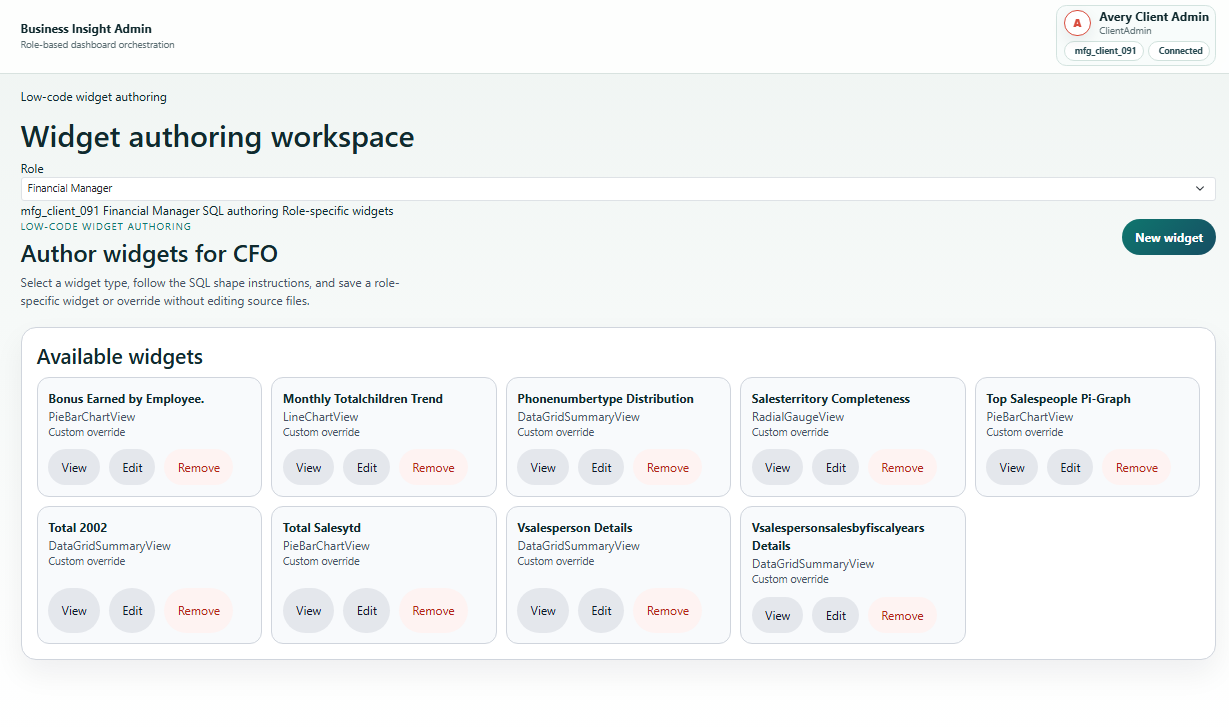
A widget is one business question shown visually. The workshop lets admins find, review, create, and maintain the widgets that appear on role dashboards.
How to use it
- Filter widgets by role, title, or status.
- Open an existing widget to verify its query and display type.
- Create a new widget when a dashboard needs a new KPI, chart, or table.
- Use the workshop before publishing dashboards to client users.
Client Admin - New Widget Definition
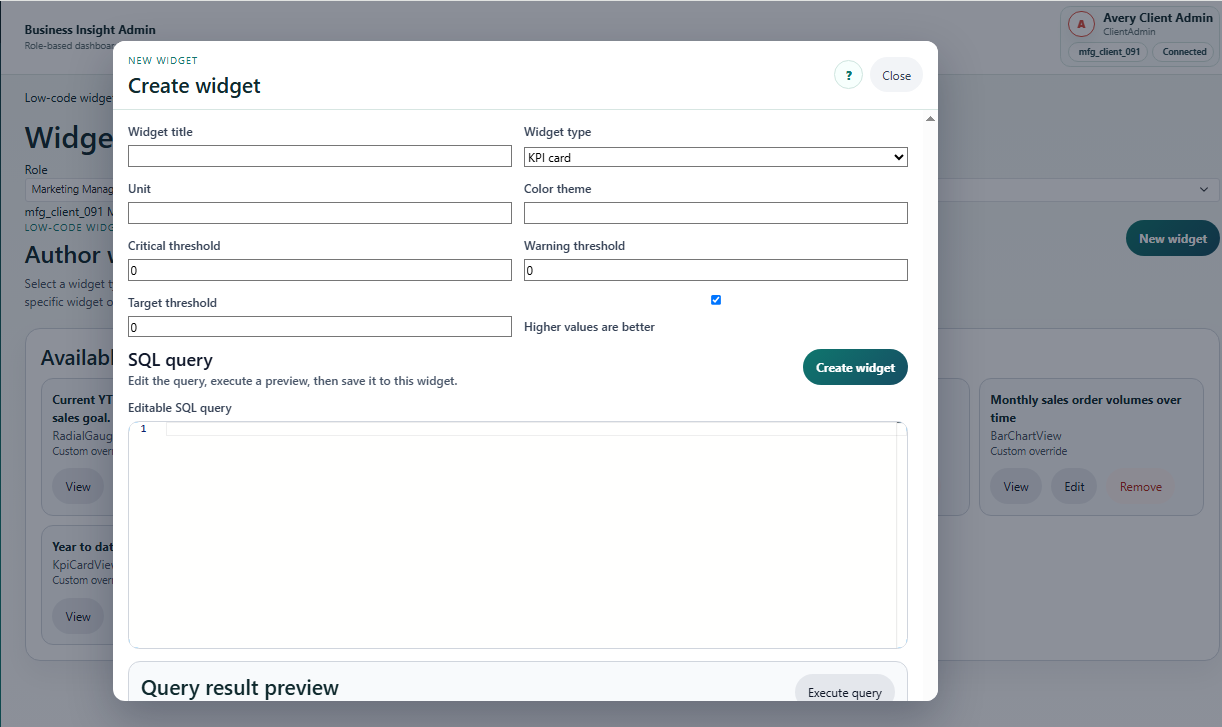
Purpose
This screen defines what a widget means, which data it reads, how it should look, and which role should see it.
How to use it
- Choose the role and dashboard where the widget belongs.
- Write a business title that managers understand.
- Select the display type such as card, line chart, radial gauge, bar chart, or summary view.
- Choose the data source: Local agent SQL for data read through the BusinessInsight Agent, or API endpoint for data returned by a client endpoint.
- Map the query output fields to labels, values, targets, thresholds, or categories.
- Save and test before showing it to end users.
Using API Endpoints as Widget Data Sources
BusinessInsight widgets can read data from a client API endpoint as well as from the local Agent. Use this option when a client already has approved REST endpoints, when an ERP or web application can expose reporting data safely, or when Trend Developers creates an endpoint adapter for the required widgets.
How to configure an API widget
- Open Widget Authoring and create or edit a widget.
- Select the widget type: KPI card, radial gauge, bar chart, line chart, pie/bar chart, or summary grid.
- Set Data source to API endpoint.
- Enter a relative endpoint such as
/api/v1/client-data/adventureworks/metrics/sales/revenue-mtd, or an absolute client URL. - Click Preview endpoint. The endpoint must return one JSON metric payload.
- Save the widget after the preview matches the expected chart or table.
Endpoint requirements
- Return HTTP 200 with JSON content.
- Use the BusinessInsight metric shape shown below.
- Set
displayName,value,unit,status, andlastUpdatedUtc. - Use
seriesfor line and bar charts. - Use
summaryRowsfor pie/bar charts and summary grids. - Protect the endpoint with the client's normal API security when required. BusinessInsight forwards the current authorization header when available.
Clients may use endpoints they already have. Trend Developers can also help design or build the API endpoints. Pricing is decided after reviewing the requirement, endpoint security, data transformation, and widget complexity.
Metric JSON contract
| Field | Required For | Meaning |
|---|---|---|
displayName |
All widgets | Business label shown in preview, dashboards, and mobile views. |
value |
KPI, radial, chart headline value | Main numeric metric. For charts, this can be the latest, total, or selected headline value. |
unit |
All widgets | Short unit label such as %, USD, orders, units, hrs, or records. |
trendDirection |
Optional but recommended | Use Up, Down, or Stable. |
status |
All widgets | Use Optimal, Warning, or Critical. |
series |
Bar chart, line chart | Array of points with label, timestampUtc, and numeric value. |
summaryRows |
Pie/bar chart, summary grid | Array of rows with label, value, status, and optional cells dictionary. |
Sample endpoint responses by widget type
{
  "displayName": "Revenue MTD",
  "value": 1384200.00,
  "unit": "USD",
  "trendDirection": "Up",
  "status": "Optimal",
  "lastUpdatedUtc": "2026-07-15T09:00:00Z",
  "series": [],
  "summaryRows": []
}{
"displayName": "Production Efficiency",
"value": 87.5,
"unit": "%",
"trendDirection": "Stable",
"status": "Optimal",
"lastUpdatedUtc": "2026-07-15T09:00:00Z",
"series": [],
"summaryRows": []
}For API endpoint widgets, the radial gauge reads the current numeric value. Target, warning, and critical thresholds are configured in the widget definition.
{
  "displayName": "Orders by Month",
  "value": 1329,
  "unit": "orders",
  "trendDirection": "Up",
  "status": "Optimal",
  "lastUpdatedUtc": "2026-07-15T09:00:00Z",
  "series": [
    { "label": "Jan", "timestampUtc": "2026-01-31T00:00:00Z", "value": 428 },
    { "label": "Feb", "timestampUtc": "2026-02-28T00:00:00Z", "value": 382 },
    { "label": "Mar", "timestampUtc": "2026-03-31T00:00:00Z", "value": 519 }
  ]
}{
"displayName": "Sales Trend",
"value": 412380.00,
"unit": "USD",
"trendDirection": "Up",
"status": "Optimal",
"lastUpdatedUtc": "2026-07-15T09:00:00Z",
"series": [
{ "label": "Jan", "timestampUtc": "2026-01-31T00:00:00Z", "value": 361200.00 },
{ "label": "Feb", "timestampUtc": "2026-02-28T00:00:00Z", "value": 389450.00 },
{ "label": "Mar", "timestampUtc": "2026-03-31T00:00:00Z", "value": 412380.00 }
]
}{
"displayName": "Sales by Territory",
"value": 1258000.00,
"unit": "USD",
"trendDirection": "Stable",
"status": "Optimal",
"lastUpdatedUtc": "2026-07-15T09:00:00Z",
"summaryRows": [
{ "label": "Northwest", "value": "522000", "status": "Optimal" },
{ "label": "Southwest", "value": "441000", "status": "Optimal" },
{ "label": "France", "value": "295000", "status": "Warning" }
]
}{
"displayName": "Bonus Earned by Employee",
"value": 0,
"unit": "%",
"trendDirection": "Stable",
"status": "Optimal",
"lastUpdatedUtc": "2026-07-15T09:00:00Z",
"summaryRows": [
{
"label": "Employee 274",
"value": "12.5%",
"status": "Optimal",
"cells": {
"EmployeeID": "274",
"EmployeeName": "Linda Mitchell",
"BonusEarned": "12.5%",
"SalesYTD": "4251368.55"
}
},
{
"label": "Employee 275",
"value": "9.1%",
"status": "Warning",
"cells": {
"EmployeeID": "275",
"EmployeeName": "Jae Pak",
"BonusEarned": "9.1%",
"SalesYTD": "4116871.23"
}
}
]
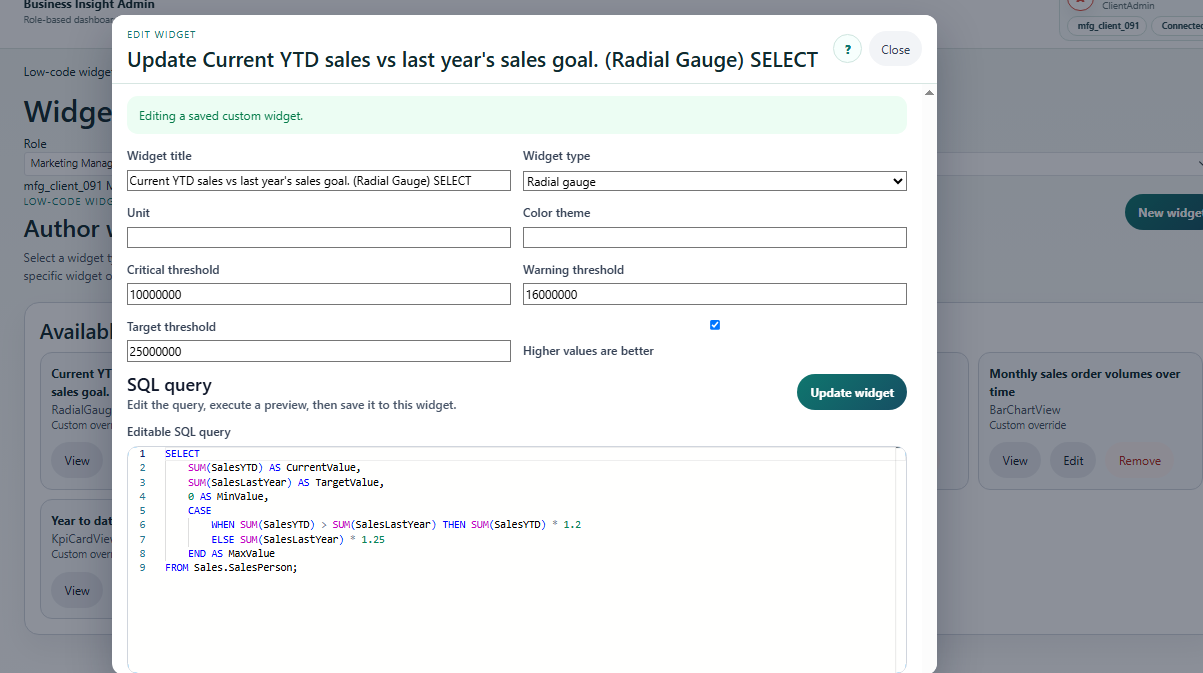
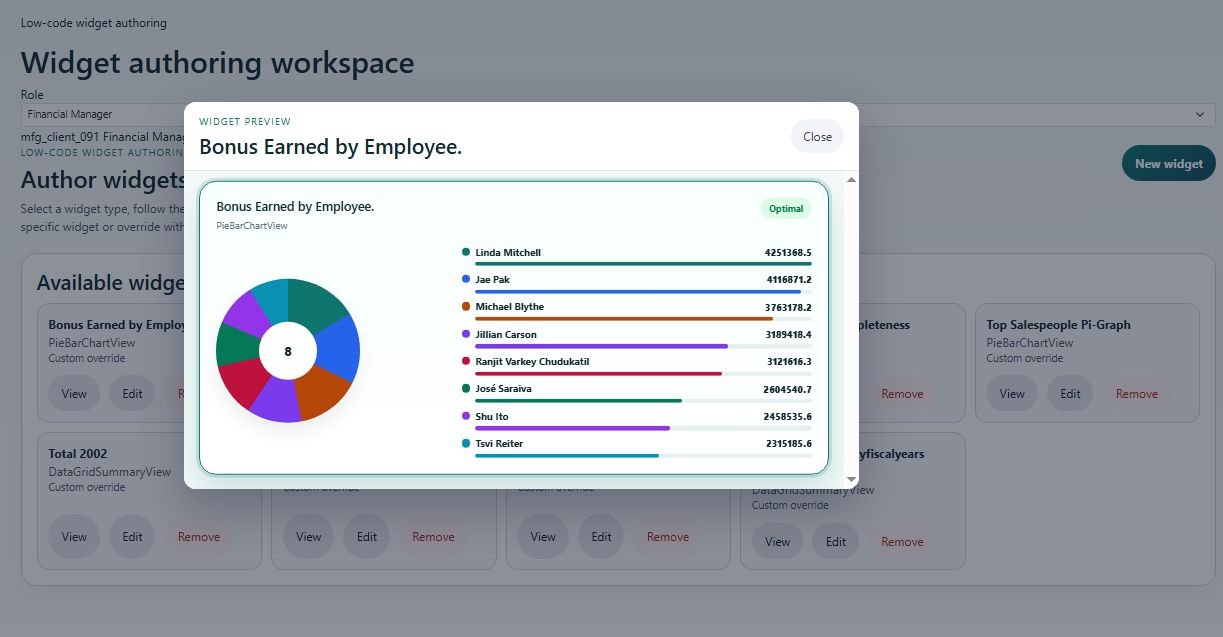
}Client Admin - Edit and View Widgets
After a widget is created, client admins can inspect the saved definition and edit it when dashboard requirements change.
Mobile User - Login Screen
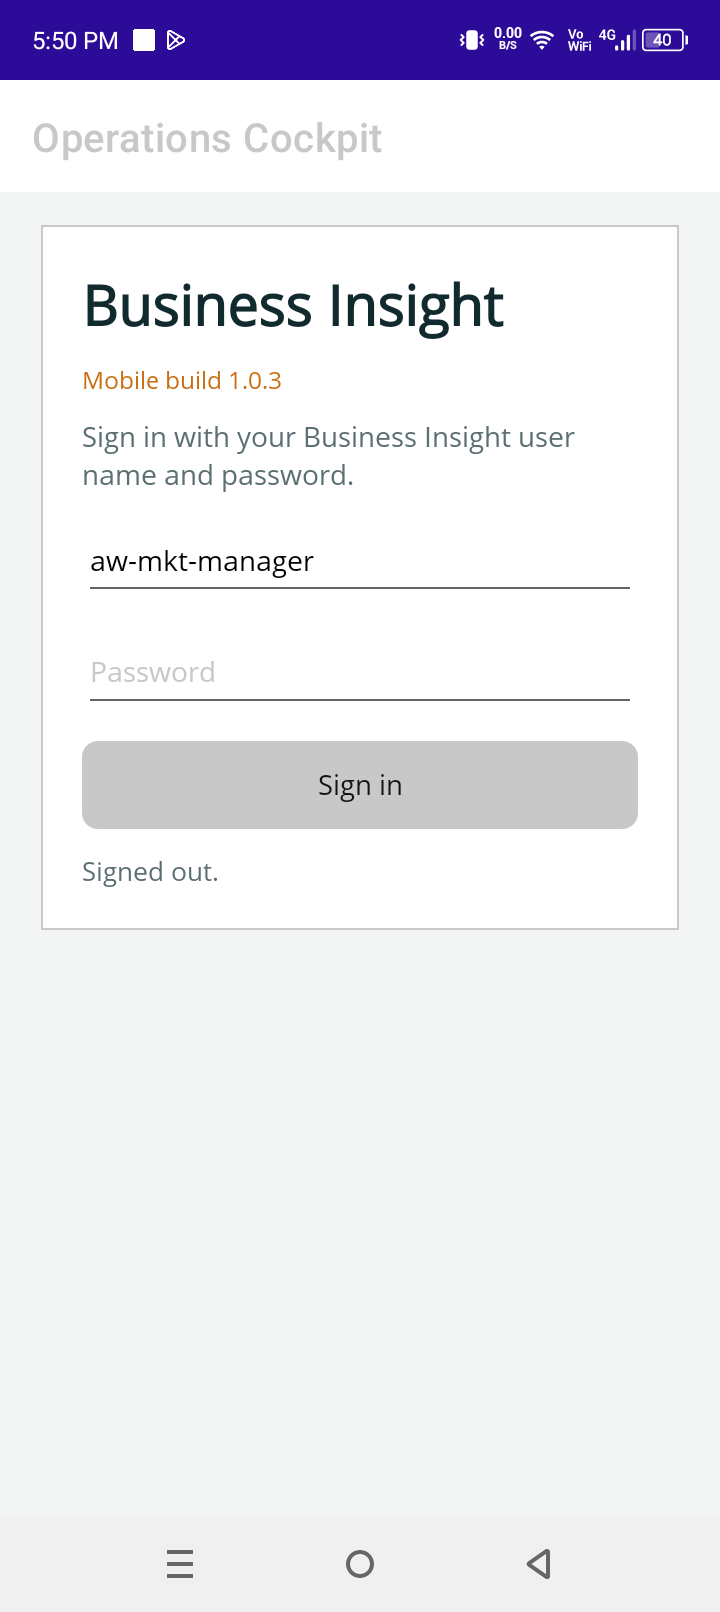
Purpose
The mobile login screen gives managers secure access to business dashboards from a phone. It is designed for users who need visibility away from a desk.
How to use it
- Enter the same assigned BusinessInsight credentials.
- Open the dashboard for the user's tenant and role.
- Use mobile views during meetings, travel, field visits, or plant walk-throughs.
Mobile User - Dashboard Cards and Trend Charts
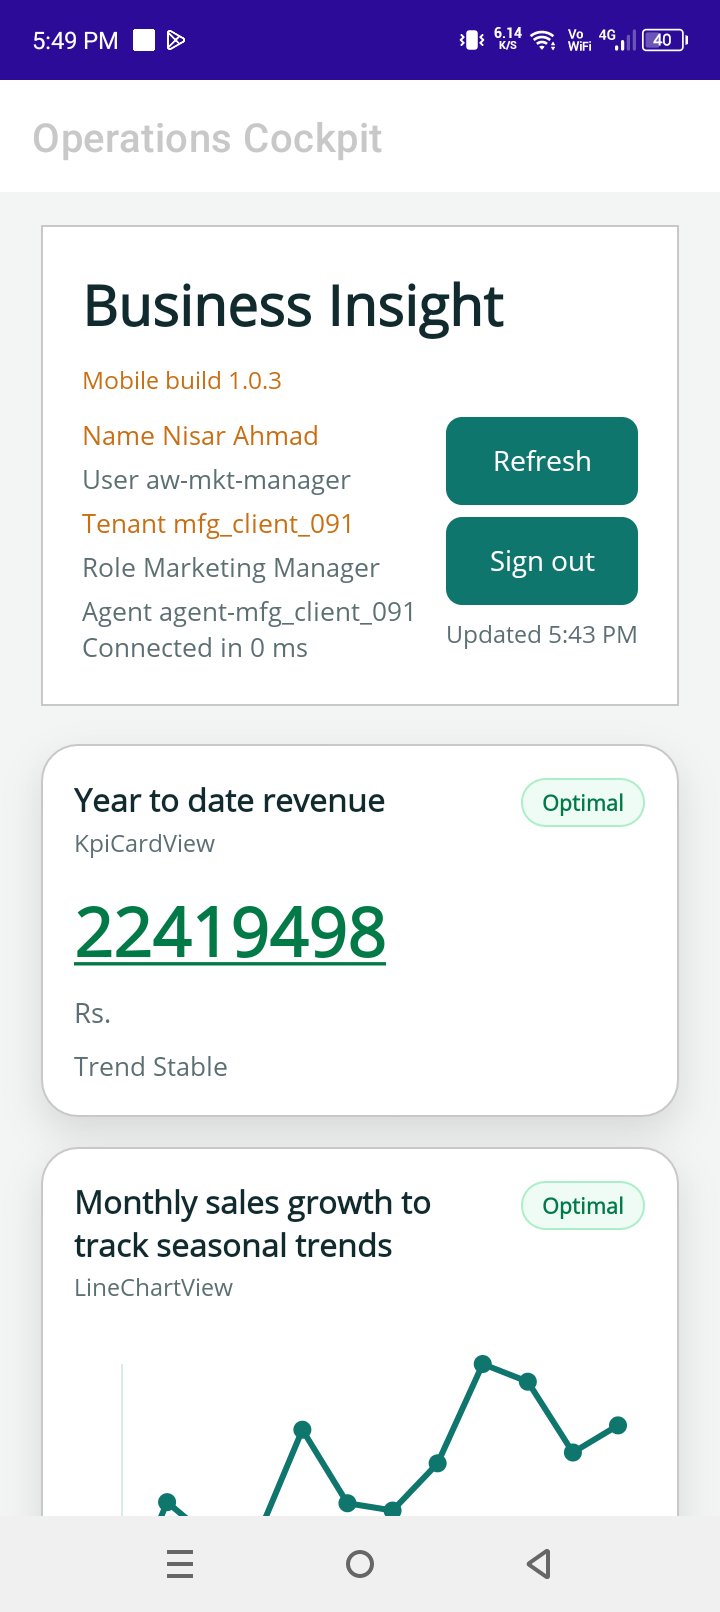
Purpose
Cards make the current KPI easy to scan. Line charts help users understand whether the number is improving, declining, or stable over time.
How to use it
- Open the role dashboard on mobile.
- Review card values first to identify priority items.
- Use the line chart to compare the current value against recent history.
- Tap or scroll through widgets to continue the dashboard review.
Mobile User - Radial, Bar, Pie, and Summary Views
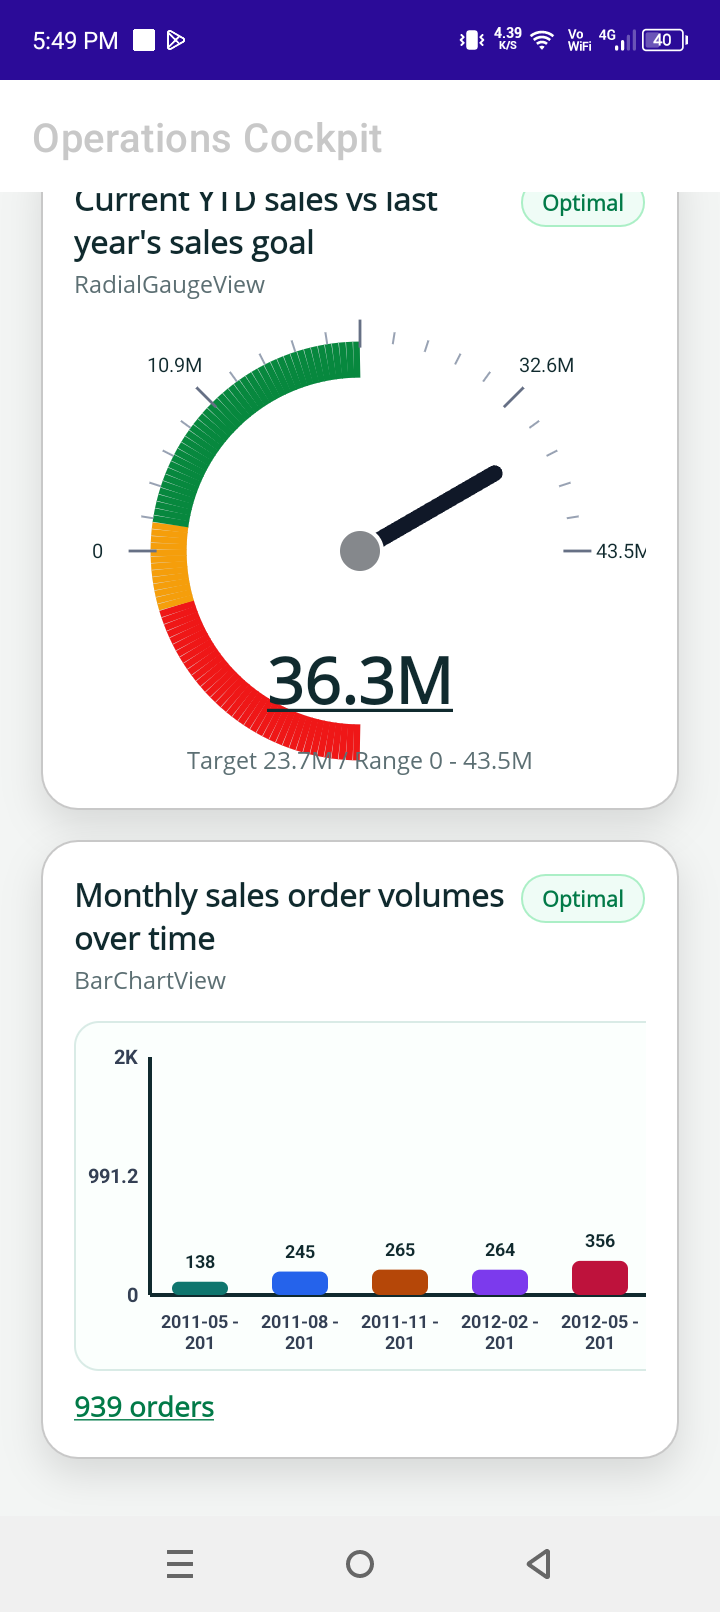
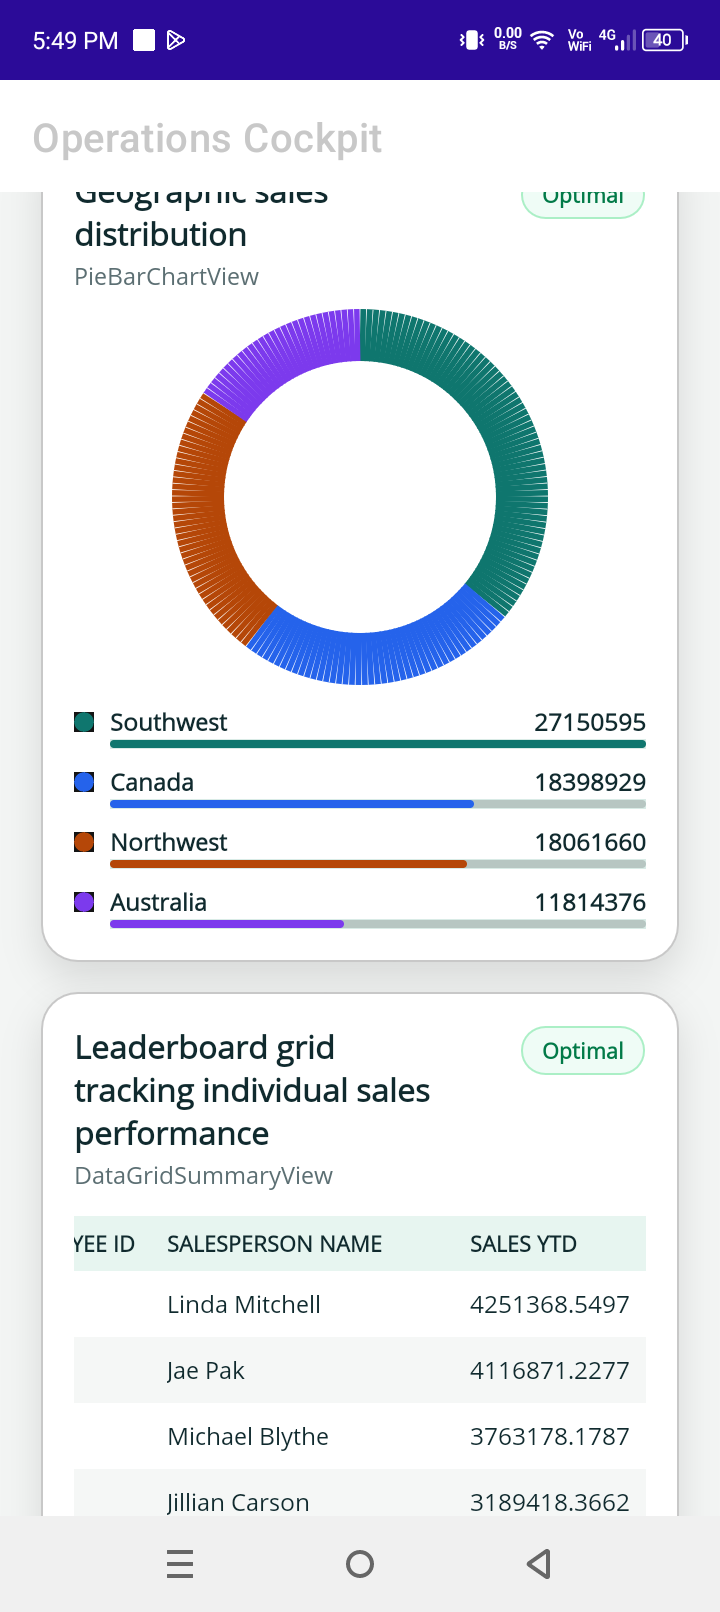
BusinessInsight mobile dashboards support several chart types so each metric can be shown in the form that best explains it.